


Decoding Serving Sizes: What You Need to Know
What serving sizes are based on, how they help you, and how they don't.

Hello, readers! In this week’s edit, I’m sharing Part 2 of my label reading series - Decoding Serving Sizes. This includes what serving sizes are based on, how they’re helpful as a tool when selecting products, and why they’re not an indication of how much you should eat. This series is the foundation of understanding food labels on a deeper level, ultimately helping you assess and select products at the grocery store. In case you missed it, you can read Part 1 of my label reading series on Percent Daily Value and the “2000-Calorie Diet” here.
Since we have American and Canadian friends here, I’ve included examples and information from both labels. But unless otherwise noted, assume the content below applies to both Canada and the U.S.
If you’re reading this on Substack and haven’t already done so, hit the Subscribe button below so you don’t miss any future editions of The Grocery Edit!
If you’re reading this on email, you can access previous editions of The Grocery Edit by downloading the free Substack app below.

Serving sizes: the basics
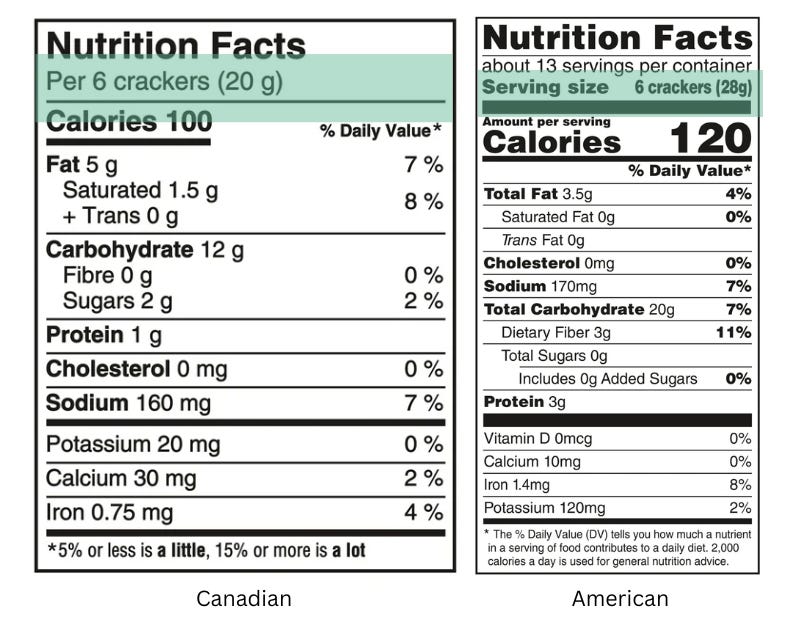
Serving size is a reference amount of food listed at the top of the nutrition facts table. This section of the food label is important because the nutrients listed below are calculated based on this specific serving size. Serving sizes have evolved over the years to become more user-friendly by including common measurements and more accurately representing a “typical” amount of food consumed in a sitting (more on this later). Food labels currently require a common measure (e.g., tbsp, cup) followed by a metric unit that represents the volume (fluid) or weight (solids) of the specified portion of food. For example, the serving size in the Canadian label below is 6 crackers, and the weight of 6 crackers is 20g. If common measures aren’t applicable, you may find some serving sizes that reference a specific number of pieces or a fraction of the food item, for example, 4 crackers or 2 slices of pizza.
Serving sizes are meant to reflect TYPICAL consumer intake, which is NOT the same as INDIVIDUAL consumer intake.
Serving sizes are based on reference values that the FDA and Health Canada have identified for each food category. These reference values serve as guidance for the food industry to ensure consistency in food labels within product categories and provide a basis for determining whether foods qualify for nutrient content claims.
In the U.S., current reference values are primarily based on the 1977-1978 and the 1987-1988 Nationwide Food Consumption Surveys, with consideration also given to the 2003-2004, 2005-2006, and 2007-2008 National Health and Nutrition Examination Survey (NHANES) data. The FDA determined the current reference values by considering average, midpoint, and most common portion sizes reported in 24-hour food recalls from these surveys for individuals over 4 years of age. Recent updates to serving sizes include reducing the reference value for yogurt from 8 ounces to 6 ounces, and increasing the reference value for ice cream from 1/2 cup to 2/3 cup to better align with typical American portion sizes. Additionally, the weighted reference value for cereal was adjusted so that most cereals now reflect a 1-cup (250 ml) serving size.
In Canada, current reference values are primarily based on the 2004 Canadian Community Health Survey (CCHS). Similar to NHANES, CCHS used 24-hour recalls that included portion sizes. In addition, Health Canada conducted a market analysis to review existing Canadian and American food labels and took feedback from prior nutrition facts tables. Over the past decade, Canada has made several changes to serving sizes, including increasing the serving size for bread from 1 slice to 2 slices to reflect typical consumption and standardizing the serving size for cereal to 1 cup (250 ml).
While the data used to determine reference values can provide general insight into common or average portion sizes, it is not an accurate representation of individual portion sizes. For example, in the most recent NHANES, median whole grain cereal portion sizes for adults ranged widely from 30-175g. For context, a 1 cup (250 ml) serving of plain Cheerios weighs 27g. Using Cheerios as an example, this equates to portion sizes ranging from 1 to 6 cups of cereal. As you can see, the reference value may be common or average for some people, but drastically different from “typical” intake for others.
Over the last decade, the serving size of some foods has increased, sparking pushback in response to growing public health concerns surrounding obesity and chronic diseases. As we saw with the percent daily value, government nutrition targets are often developed with moderation and the prevention of over-consumption in mind. But when it comes to serving sizes, reference values have been adjusted over time with a priority of helping people better understand what’s in the amount of food they are actually eating. Some critics have also suggested that serving sizes of certain foods should increase to encourage a higher consumption of nutritious foods. However, serving sizes are based on popultaiton consumption data and not nutritional intake.
An exception applies to single-serving foods which must reflect the nutrition facts for the entire container.
A single-serving container is a product that is packaged and sold individually and contains less than 200 percent of the applicable reference amount. For example, an individually wrapped protein bar or a small container of soda. Because these products are likely to be consumed in full in one sitting, they must list the entire container size as a serving size. For example, the reference value for carbonated beverages is 360 ml (U.S.) and 375 ml (Canada). So the serving size on a 500 ml bottle of soda must reflect the entire contents, as this is most likely to be consumed in one sitting.
Previously, products could (and some did) list 1/2 of the item’s contents as a serving size (for example, 1/2 a bar or 250 ml of a 500 ml soda), which was misleading to many consumers who skimmed the nutrition facts table and failed to notice that the nutrition listed was only for 1/2 of the product.
Serving sizes on packaged foods are a benchmark on which the nutrition facts table is based, not a suggested intake for consumers.
In addition to guiding the food industry, standardized serving sizes make it easier for consumers to compare similar products at the grocery store because the nutrients listed are based on the same portion size. But let’s be clear: the goal of “typical” serving sizes is to provide data on the nutrition facts table that more accurately represents the portion of food you are most likely to eat, not as a suggestion of how much you should eat.
However, I see serving sizes misinterpreted in practice all the time. Label reading is one of my favourite topics to teach in group seminars. And I can’t tell you how many times someone has exclaimed “I can only eat four crackers?!” as I show an example of a nutrition label, or has shared that they feel guilty for eating more than a serving of food, or has reassured me that they carefully count 26 chips into a bowl to limit themselves to a serving.
Appropriate serving sizes at the individual level will vary widely depending on many factors—height, weight, age, activity level, muscle mass, prior history of weight loss, genetics, nutrition goals, and what else you’ve eaten that day, to name a few. Let’s also remember that these serving size reference values are meant for everyone over the age of 4. This means that whether you’re a kindergartener, a sedentary adult, or a college football player, you’re looking at the same serving size. So think of the serving size as a unit of measurement, not a recommendation. You may find that the serving size noted is appropriate for you, and that’s fine. But if this isn’t the case, remember that yes, you can have 6 crackers even though the serving size is only 4.

Though they don’t help you decide how much to eat, standard serving sizes are still helpful for comparing and selecting products.
The progress that has been made to standardize serving sizes and make them more reflective of typical intake is positive, as long as they’re used correctly. Before standardization, the food industry was more or less left to its own devices and serving sizes varied, making it nearly impossible to compare the nutrition facts of similar products. It’s much easier to compare sugar in two different cereals now, each with 1-cup serving sizes, than having to do math as you stand in the cereal aisle to compare a 3/4-cup serving size to a 1-cup serving.
So use the serving sizes as a reference point when you’re reading labels, but keep in mind that the serving size may not reflect how much YOU will eat (and that’s okay!). This just means that if you’re looking to see how much fibre you’ll get from your favourite brand of crackers, you may need to do some math to figure it out based on the amount that you’ll actually eat.

Thank you for reading! I would love to hear from you - send me a message by clicking the button below or via the Substack app chat.
If you enjoyed this newsletter, please show it some love by liking it or sharing it below 👇 .
Talk soon,
~Brittany
“The Grocery Edit” is written by Brittany Raftis, MScFN, RD. She works as a Registered Dietitian and is passionate about helping people sort through the confusion of ingredients and nutrition facts to reduce stress surrounding daily food choices. She uses an evidence-based approach to clear up misinformation about nutrition and help people select the right products to support their health and enjoyment of food.