


Percent Daily Value: the average 2,000-calorie diet, reference values, and how to use it
Why the "average 2,000-calorie diet" is made up, %DV reference values, and how %DV can help you select products at the grocery store.

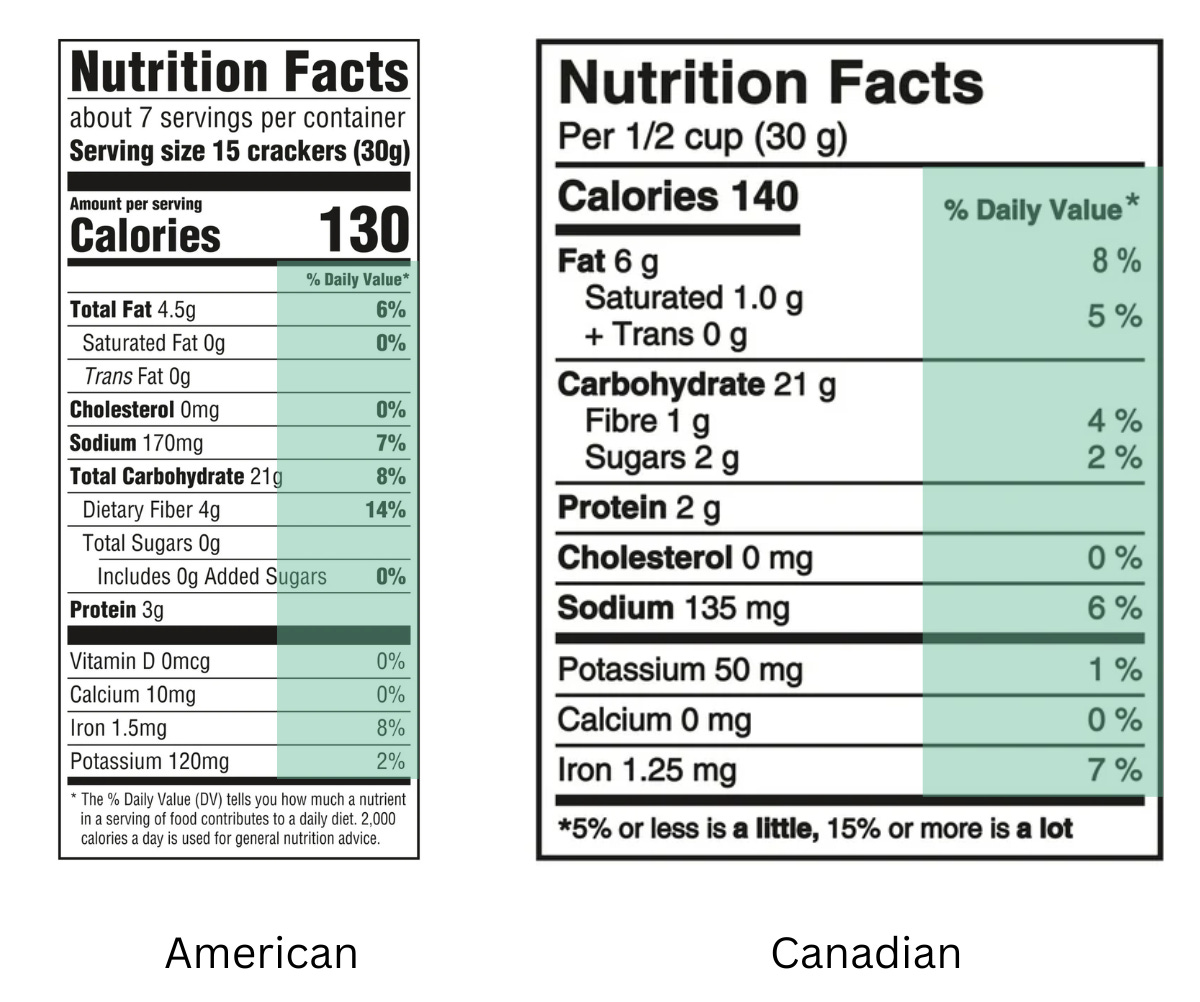
Hello, readers! In this week’s edit, we’re doing a deep dive into the Percent Daily Value (%DV) - that column of percentages on the right side of a nutrition facts table. I’m covering what it’s based on, how the 2,000-calorie diet is made up, reference values, and how it can help you select products at the grocery store.
Since we have both American and Canadian friends here, I’ve included reference values for both countries. In most cases, they’re the same. So unless otherwise noted, assume the content below applies to both Canada and the U.S.
Note: if part of this post gets cut off in your inbox (due to length), click the ‘READ IN APP’ button at the top of this page for the full version.
If you haven’t already done so, hit the Subscribe button below so you don’t miss any future editions of The Grocery Edit!
You can also access previous editions of The Grocery Edit by downloading the free Substack app below.

Let’s get into it…
What even is Percent Daily Value?!
The %DV is the list of percentages in the right column of a nutrition facts table. The main purpose of this tool is to help consumers understand the nutrition information on food labels and its relative importance in a total daily diet.
On food labels today, there is a mandatory %DV for the following nutrients:
Total fat
Saturated fat
Total carbohydrate (American only)
Fibre
Total sugar (Canadian only)
Added sugar (American only)
Cholesterol
Sodium
Potassium
Vitamin D
Calcium
Iron
Note: there are also values for additional nutrients, but for the sake of time, I’m focusing only on the %DV for the mandatory nutrients listed on a food label.
These daily values are calculated based on the foundation of a 2,000-calorie diet and represent the percent of daily nutrient needs that a serving of food provides. For example, if a product contains 7% DV of fat per serving, it provides 7% of daily fat needs. I’ll share how each %DV is calculated in a moment, but let’s first clear up what the 2,000-calorie diet is all about.
A 2,000-calorie diet is not actually average, it’s a [mostly] made-up number meant to discourage overconsumption, specifically for women.
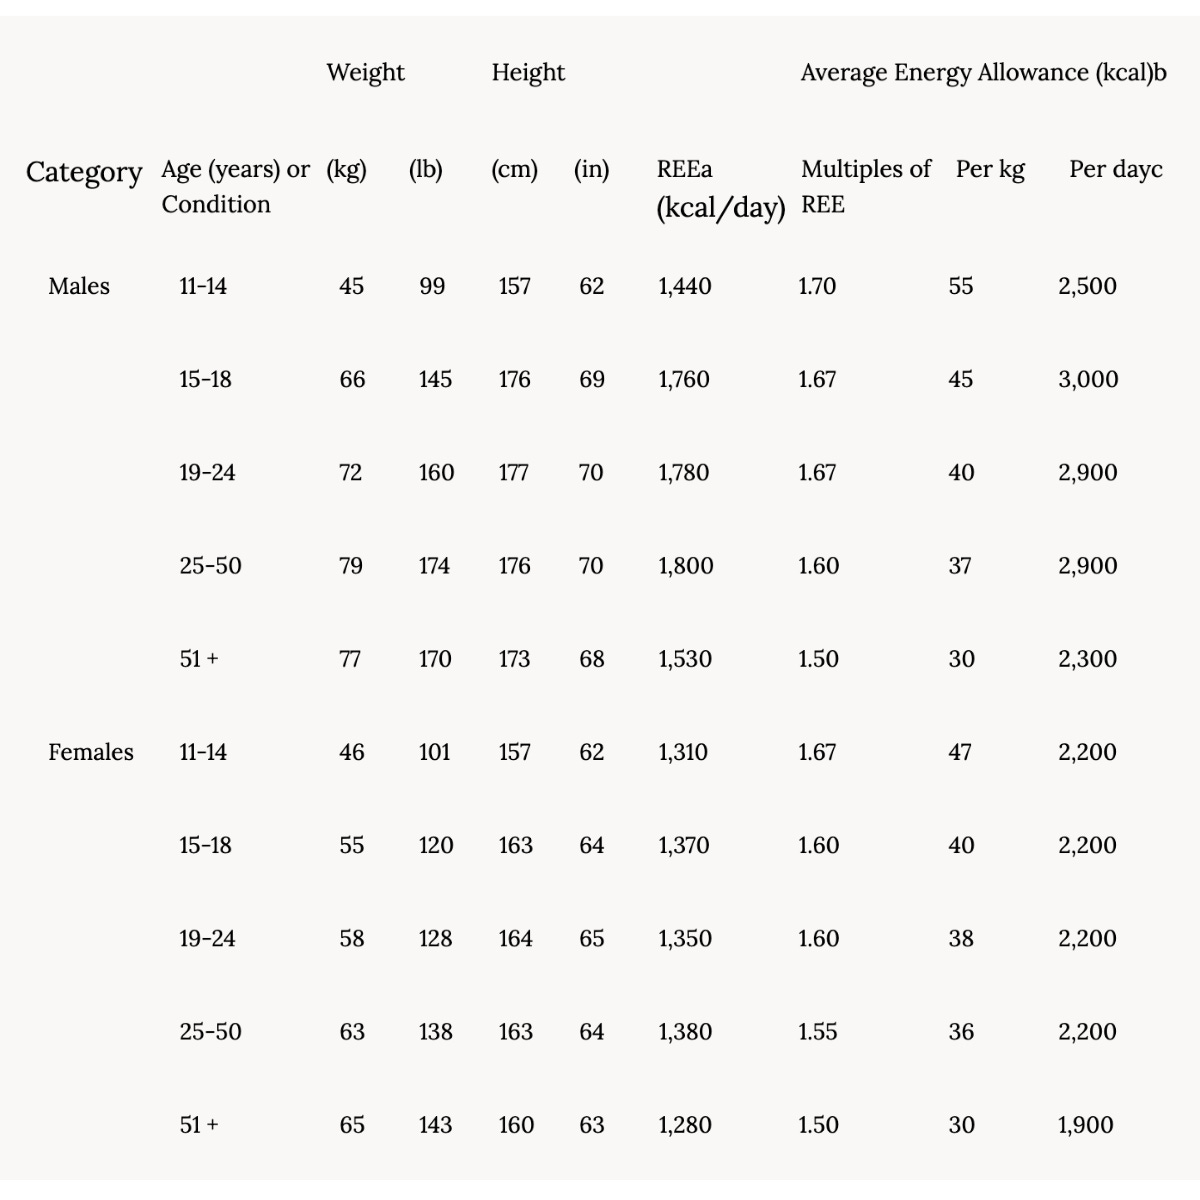
For decades, we’ve heard that the average calorie need for an adult is 2,000 calories. But where did this figure actually come from? The Nutrition Labelling and Education Act was passed in 1990 to standardize food labels. At that time, the FDA needed a reference calorie intake to create daily values. To do this, they calculated calorie needs using the median weight of adults from 1976-1980 National Health And Nutrition Examination Survey (NHANES) data.
The weights used to determine calorie intake are listed in the chart below. For example, the median weight for males aged 25-50 was 174 lbs, and 138 lbs for females in the same age category.
The FDA initially proposed 2,350 calories as the benchmark calorie intake based on a population-adjusted average from people aged 4 years and older.
The actual average intake from this data is 2,508 calories, and this was adjusted to reflect demographics from the general population.
However, there were several concerns about the 2,350-calorie reference value, as many thought it was too high, especially for women. A lower number was recommended as a conservative measure to prevent at-risk groups from overconsuming calories, such as older women with lower calorie requirements.
The FDA also believed that using a round number of 2,000 calories would be easier for consumers to remember and use in calculations. And just like that, the average 2,000-calorie diet, as we know it today, was born and has been used ever since.
You’ll notice in the chart above that every age range had calorie needs higher than 2,000 calories, except women in the 51+ category.
The AVERAGE needs of adults do NOT equal the needs of MOST adults, anyway.
While the 2,000-calorie diet was created by the FDA as a benchmark for calculating daily values, it has been misconstrued over the years. American labels (and previous editions of Canadian food labels) contain a footnote stating “The % Daily Value tells you how much a nutrient in a serving of food contributes to a daily diet. 2,000 calories a day is used for general nutrition advice”.
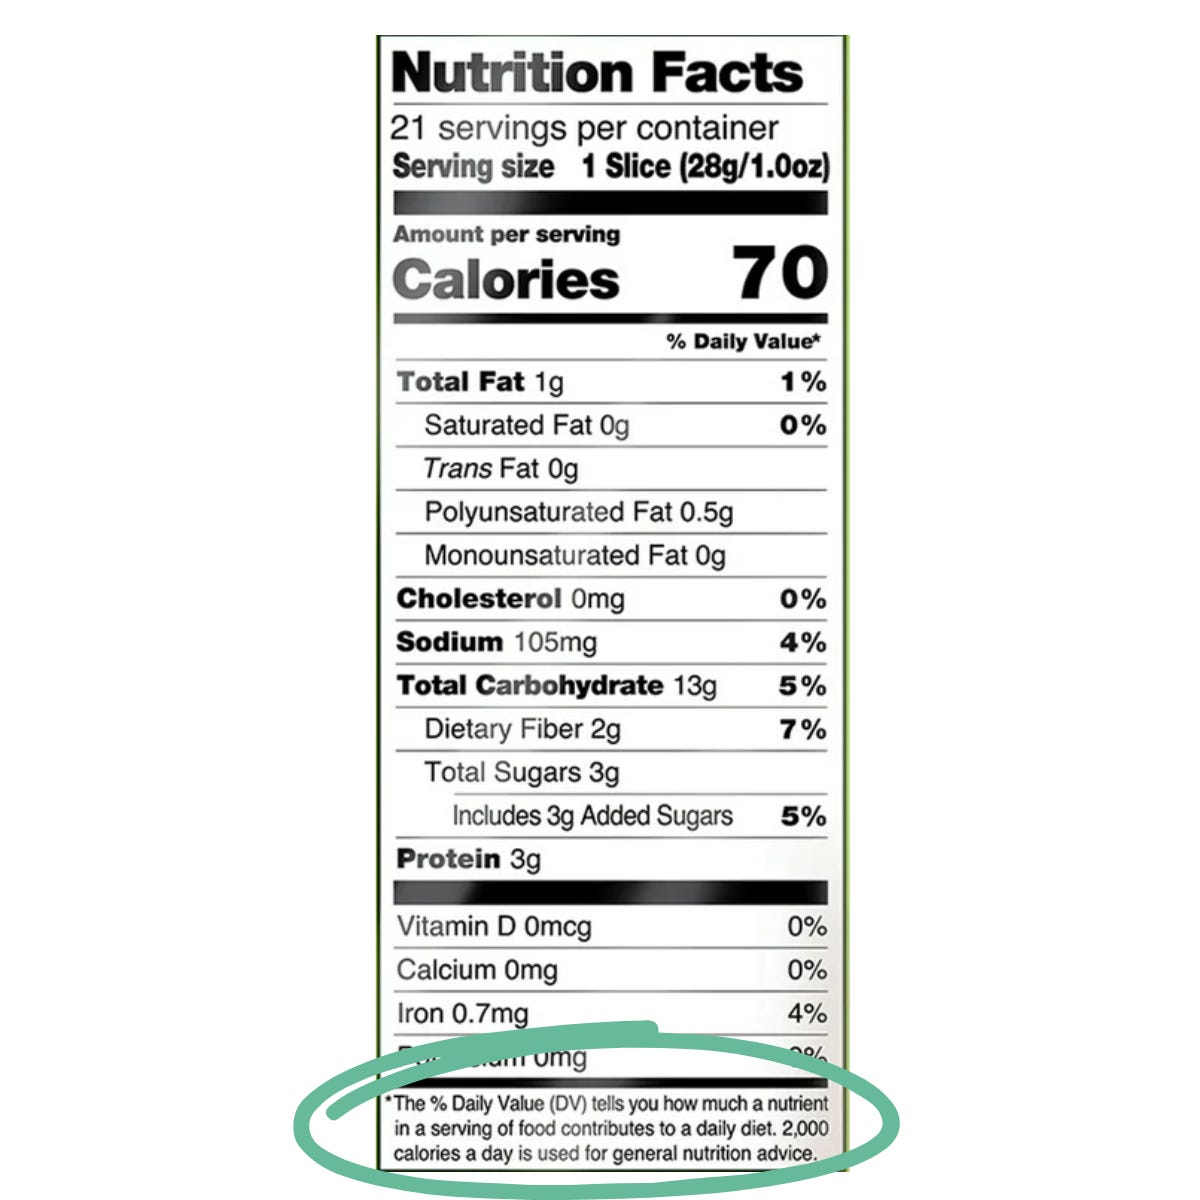
Despite this disclaimer, the 2,000-calorie diet has been commonly misunderstood to represent what most adults need. Though %DV is a public health tool not intended to meet the needs of every individual, from what I see in practice, most consumers apply this directly to themselves.
Here’s why this doesn’t work: to start, calculating calorie requirements is an estimate. If I have accurate measurements and activity levels for individuals, I can get a fairly good sense of their calorie needs using math. But it’s not an exact science. Then when we take these individual estimates, add them up and get an average, the value becomes representative of the group as a whole, but less accurate for any one individual.
Let’s also remember that 2,000 calories is not the population’s actual average calorie needs - which is closer to 2,500 based on the above data. The actual estimated average was adjusted to a seemingly random round number. So, not only is it not reflective of the needs of most individuals, it’s not even reflective of the average needs of our population. If anything, it’s only an accurate average for women over 51.

The 2,000-calorie diet TL;DR
Bottom line, the 2,000-calorie diet was created as a benchmark number. Though initially based on the average calorie needs of people over 4 years of age, it is not an accurate representation of the needs of most consumers and should not be used in this way. Let’s take this number with a grain of salt and remember that it represents only an example of an average diet, not your individual needs as a consumer.
Reference Values for Percent Daily Values
Beyond the 2,000-calorie diet, each %DV is based on a reference value. In some cases, these values are based on the recommended percentage of calories that the nutrient should provide as part of a 2,000-calorie diet. These actual values are less reflective of the needs of an individual consumer and should serve as a reference point only.
In other cases, reference values have nothing to do with calorie intake and are based on public health recommendations for reducing chronic disease risk. In these cases, the %DV is applicable to most healthy consumers.
Lastly, in the case of some micronutrients, a population coverage assurance approach is used to prioritize those with higher nutrient needs. These values are relevant for those in the target age/sex group and less relevant for those outside of this group.
Total Fat
The reference value for %DV for total fat on American food labels is 78g. This is calculated using 35% of a 2,000-calorie diet. This is the upper Acceptable Macronutrient Distribution Range (AMDR), or the maximum recommended percent of calories that should come from fat in the diet.
This value was previously increased from 66g (30% of total calorie intake), due to concerns that consumers might not meet their needs for essential fatty acids and potentially view sources of healthy fats as unfavourable if the reference range is too low.
In Canada, the reference value for total fat on food labels is 75g. This is also calculated using the upper AMDR of 35% of total calorie intake and rounded down to 75g. This daily value is intended to discourage excessive fat intake.
Saturated fat
The reference value for saturated fat is 20g. This is calculated based on the recommendation to limit saturated fat intake to less than 10% of total calories, using a 2,000-calorie diet. The purpose of this daily value is to help consumers limit saturated fat intake based on the associated risk for cardiovascular disease.
Total carbohydrates
A %DV for total carbohydrates exists only on American food labels. The reference value for total carbohydrates is 275g. This was calculated using 55% of total calorie intake based on a 2,000-calorie diet (the midpoint of the 45-65% AMDR). However, in this case, the FDA has noted that the Recommended Daily Allowance (RDA) for carbohydrates is much lower than this reference value, at 130g per day, so the DV should be used as a reference amount and not an intake recommendation.
In Canada, the %DV for carbohydrates was removed in the most recent update of the nutrition facts table and was replaced with a %DV for total sugar (see below). This change was made to reflect current nutrients of public health concern.
Fibre
The reference value for fibre on American food labels is 24g. This is calculated using the Adequate Intake (AI) of 14g of fibre per 1,000-calories consumed, using a 2,000-calorie diet. In Canada, this same method was used to determine the fibre reference value, but the target of 28g is used instead of 24g to encourage a higher fibre intake.
Sugar
The reference value for sugar on American food labels is for added sugar only. This is set at 50g and is based on the recommendation to consume less than 10% of your total calorie intake from added sugar, based on a 2,000-calorie diet.
In the most recent nutrition label update, Health Canada did not opt to include added sugar as a separate line item. Instead, Canadian food labels have only one line for total sugar. The reference value for total sugar in Canada is 100g. This is calculated by taking 20% of total calories, based on a 2,000-calorie diet. Health Canada states that this is not a recommended sugar intake, but is used as the reference value because “this amount of sugar is consistent with a healthy dietary pattern”.
Protein
The reference value for protein on American food labels is 50g. This is calculated using the minimum AMDR of 10% of total calorie intake, based on a 2000-calorie diet. However, including a %DV for protein is voluntary and typically not included on labels. There is currently no %DV for protein in Canada, as this is not recognized as a nutrient of concern.
Cholesterol
The reference value for cholesterol is based on the previous daily recommended intake (DRI) of 300 mg per day. Though this DRI no longer exists, it continues to serve as a benchmark for consumers on food packaging.
The current recommendation is to keep cholesterol intake as low as possible without sacrificing diet quality.
Sodium
The reference value for sodium is 2300 mg. This is based on the upper limit for disease reduction risk. This is relevant for most healthy individuals.
Potassium
The reference value for potassium in the U.S. is 4700 mg, reflective of the AI before 2019. In Canada, the reference value for potassium has been lowered to 3400 mg to reflect the current AI. Since these values are not based on calorie intake, they are relevant for most healthy individuals.
Calcium
The reference value for calcium is 1300 mg. This is based on the calcium needs of children ages 4 to 18 who have the highest calcium needs. This approach was used as a population coverage assurance approach ensuring that individuals with higher nutrient needs are accounted for.
Iron
The reference value for iron is 18 mg. This is based on the recommended intake for women of childbearing age, who have the highest iron needs. Similar to calcium, this approach was used to provide population-wide coverage, ensuring that individuals with higher nutrient needs are accounted for.
Vitamin D
The reference value for vitamin D is 800 IU. This is based on the RDA for people over 70 years of age, the stage of life with the highest vitamin D requirements. This approach provides population-wide coverage, ensuring that individuals with higher needs are accounted for.
While the purpose of the %DV tool is not to help individuals meet their nutrient needs, it serves as a useful resource to help consumers easily understand the nutrient value of foods.
The %DV can be extremely helpful in simplifying an otherwise complex nutrition facts table. For example, if a nutrition facts table lists 500 mg of sodium, this number is meaningless to most consumers who don’t know how much sodium they should consume in a day. The percent daily value converts this otherwise meaningless value into a percentage of daily needs, 22% in this case, helping to put this into perspective.
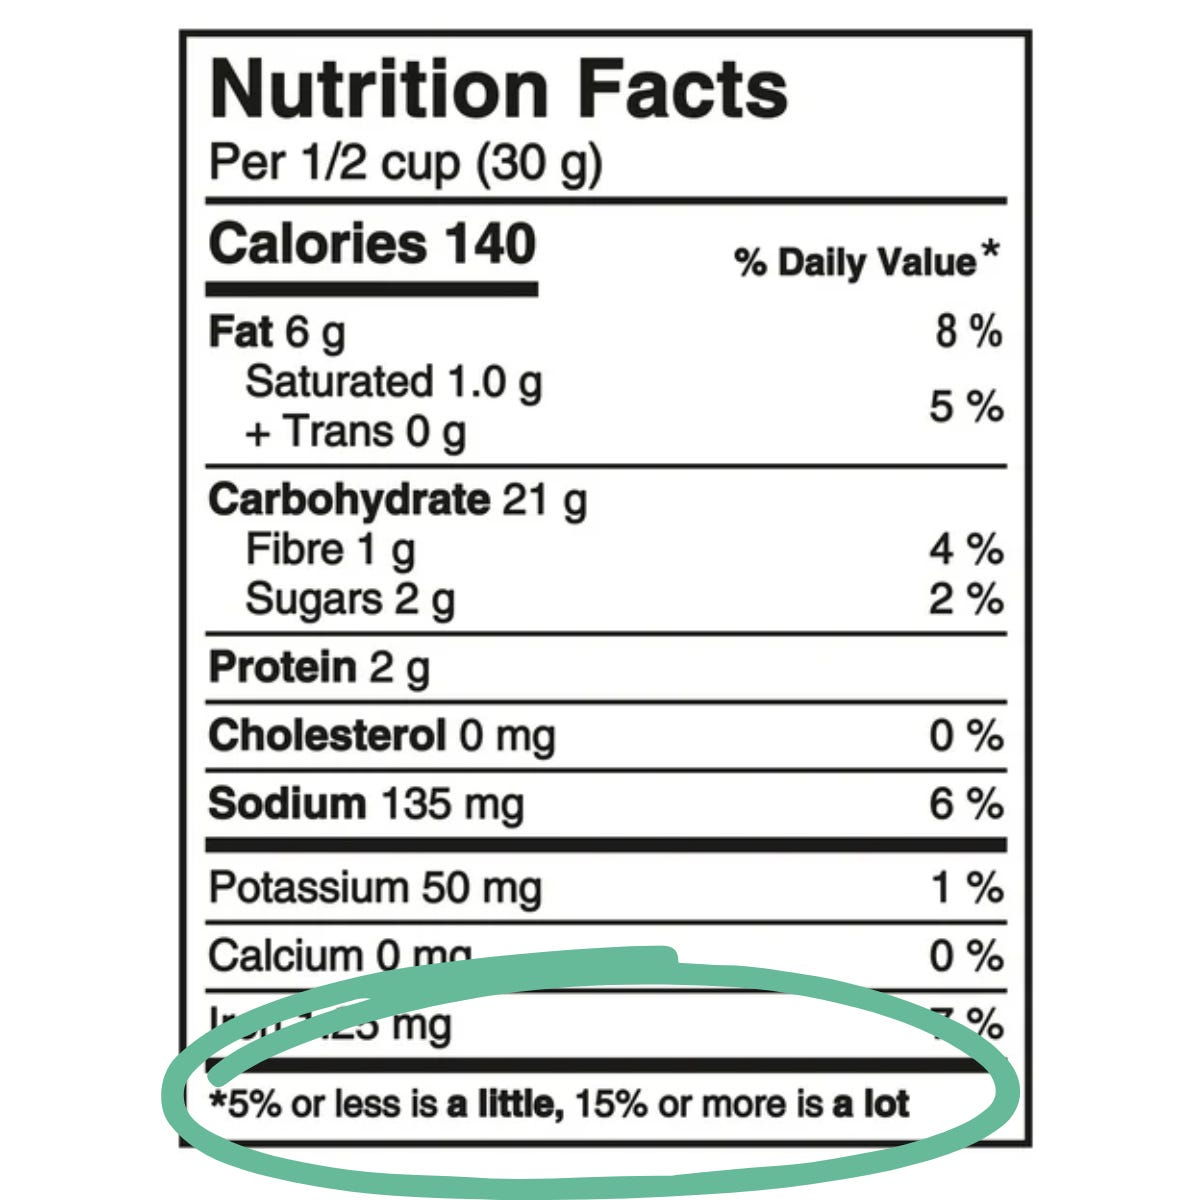
While not all consumers understand nutrients in terms of grams or milligrams, most will understand a percentage on a scale of 0-100. Both Canadian and American %DV also have a reference point for how much is considered “a little” or “a lot” of a nutrient.
Anything less than 5% DV is considered “a little”, and more than 15% (Canadian) or 20% (American) DV is considered “a lot”. Therefore, if you want to get more or less of a certain nutrient in your diet, you can use these reference points to select products accordingly.
%DV can help easily compare products.
Another way the %DV is helpful for consumers is when comparing products. The % DV allows consumers to easily compare two products based on the amount (percent of daily needs) of a nutrient present in each product. For example, a consumer comparing the sodium content of two different products – 400 mg vs. 700 mg – may not know if the 300 mg difference is significant. However, comparing the % DV for sodium – 17% DV vs. 30% DV can provide more meaningful insight.
Use %DV as a reference for the amount of a nutrient in a product, not as an indicator of your actual needs.
The %DV tool is a helpful resource for consumers to easily compare products and identify foods that are high or low in nutrients of concern. However, keep in mind that the reference amounts used to calculate %DV are primarily based on a 2,000-calorie diet, which serves as an adjusted estimate of the population’s average calorie needs but does not reflect the specific needs of most individuals.

I’d love to know what you think about %DV in the poll below!

If you enjoyed today’s post, please help spread the word by inviting your friends to join below!
Chat soon,
~Brittany
Sources:
National Research Council (US) Subcommittee on the Tenth Edition of the Recommended Dietary Allowances. Recommended Dietary Allowances: 10th Edition. Washington (DC): National Academies Press (US); 1989. PMID: 25144070.
Daily Value on the Nutrition and Supplement Facts Labels, updated May 2024.
Food Labeling: Revision of the Nutrition and Supplement Facts Labels. Department of Health and Human Services, Food and Drug Administration, 2016.
Dietary Guidelines for Americans 2020-2025. USDA, 2020.
Health Canada's Proposed Changes to the Daily Values (DVs) for Use in Nutrition Labelling, 2014.
Nutrition Labelling - Table of Daily Values, Health Canada, updated October 2022.
Dietary Reference Intakes, Health Canada, updated December 2023.